|
8.22 Sampling Theory of Correlation
By using the sampling correlation coefficient, you often have to estimate the population correlation coefficient. To do so one must know the sampling distribution of the coefficient of correlation. If the population coefficient of correlation = 0, this distribution is symmetric and the statistic having student’s ' t ' - distribution can be used. Otherwise the distribution is skewed. For such a case a transformation, given by Fisher, which produces a statistic which is nearly normally distributed is used .
1) In case of large sample ( > 30 ) the standard error of coefficient of correlation ' r '
is calculated by 
2) In case of small samples the S. E. of the
coefficient of correlation is calculated in the way as in the large
samples, with the difference of 1 - r2
,  is used. Instead of
  is
used because in the calculation of coefficient of correlation, 2
degree of freedom are lost and therefore n
(df) = n - 2. Thus the S. E. of the coefficient of correlation
in small samples is given by is
used because in the calculation of coefficient of correlation, 2
degree of freedom are lost and therefore n
(df) = n - 2. Thus the S. E. of the coefficient of correlation
in small samples is given by 
The value of '
t ' is calculated by finding out the ratio between the coefficient
of correlation and its S. E.
Thus 
Example Use ' t ' test to find whether
a correlation coefficient of 0.5 is significant if n = 51.
Solution: r = 0.5 and n = 51 then
t =  will
be will
be

From the
table t0.05,
r = 49 = 2.01
Thus the calculated value is much higher
than table value of 't', then the correlation is significant.
Example A random sample of 15 from a
normal population given the coefficient of correlation of - 0.5.
is this significant of the existence of correlation of the population
?
Solution: r = -0.5 and n = 15

The df = n - 2 = 15 - 2 = 13
From the
table t0.05,
r = 13 = 2.16.
Thus t =
- 2.07 < 2.16. hence correlation of is not significant to warrant
an existence of correlation in the population.
Example What is the least size of a sample
that is appropriated to conclude that a correlation coefficient
of 0.32 is significantly greater than 0 and 0.05 level ?
Solution : Let the sample size for t0.05
is ' n ', which is least.
Using One-sided test of ' t ' -distribution
at 0.05 level,

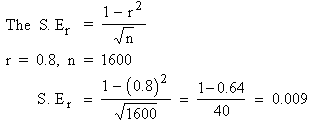
Example To study the correlation between
stature of father and the stature of son, a sample of size 1600,
is taken from the population of fathers and sons. The sample study
gives the correlation between the two to be 0.80. Within what limits
does it hold true for the population ?
Solution:

The correlation
in the population probability lies between = r ±
3 S. E. (when the sample is random and simple )
R = S
± S. E.
=
0.8 ±
3 ´ ( 0.009 )
=
( 0.8 - 0.027, 0.8 + 0.027
)
= ( 0.773, 0.827 )
|