8.13 Estimation
We have studied so far how to test the hypothesis about Mean or Population proportion from a given sample. Now we are going to determine the Mean or proportion of the population. This is known as estimation. The following types of estimations are possible:
(1) Point estimate and (2) Interval estimate.
Point Estimation: i) The best estimate of
population mean ( m ) is the sample mean
( x ) and ii) The best estimate of population proportion (P) is
the sample proportion (P').
For example i) If the average weight of 50 students of a school of 500 students is found to be 50 kg. We estimate that the average weight of all 500 students is also 50 kg.
ii) We are given a sample of 100 workers from a population of 1000 workers. If 53% smoke then we estimate that the proportion of smokers in the given population is also 53%.
Interval Estimation: 1) Population mean
:
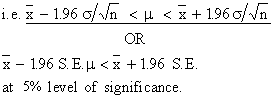
Consider | z | < 1.96 i.e. 


This gives us the interval in which we estimate x to lie with 95% confidence. They are called confidence or fiducial limits.
1)  ± 1.96 S.E. at 95% confidence level. ± 1.96 S.E. at 95% confidence level.
2)  ± 2.58 S.E. at 99% confidence level. ± 2.58 S.E. at 99% confidence level.
3)  ± 3 S.E. at 99.73% confidence level (which is almost certainly). ± 3 S.E. at 99.73% confidence level (which is almost certainly).
Note : S. E. = Standard Error = 
However, if population S.D. ( s ) is not known then replace s by s.d. of the sample.
Example A random sample of 100 girls of
8 graders of a school gave the following results:
Mean weight = 60 kgs. S.D. = 5 kgs. Find the limits within which the mean weight of the school (for girls only) almost certainly lies.
Solution: 99.73% confidence limits of
mean are x ± 3 S.E.
Now S.E. = 
Therefore the limits are 60 - 3 ´ 0.5 = 58.5 kgs and
60 + 3 ´ 0.05 = 61.5 kgs
Example The mean height obtained from a
random sample of size 100 is 64 inches. The standard deviation of
the distribution of height of the population is known to be 3 inches.
Test the statement that the mean height of the population is 67
inches at 5% level of significance. Also set up 99% limits of the
mean heights of the population.
Solution: The null hypothesis is that the
mean height of the population is 67 inches.
In notation : Ho : m
= 67 inches and Ha : m ±
67 inches
Given that m = 67, x = 64 and n = 100 with s = 3

Therefore, Ho is rejected at 5% level of significance. Hence mean height of the population could not be 67 inches.
99% probable limits of the mean of population is given by  ± 2.58 S.E. ± 2.58 S.E.
Now S.E. = 
Therefore, we have 64 ± 2.58 (0.3) inches .
= 64 - 2.58 (0.3) = 63.2 inches to 64 + 2.58 (0.3) = 64.8 inches.
|