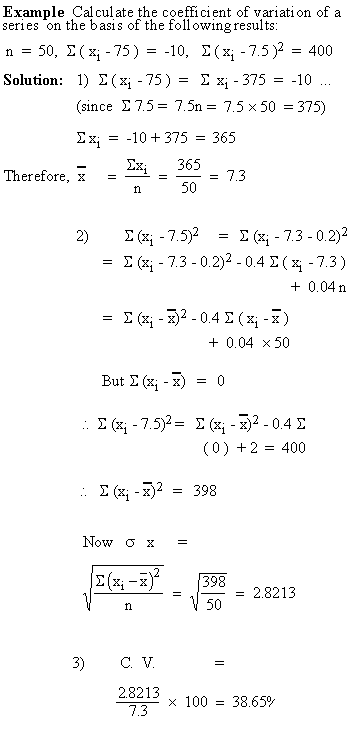
| 
 Example    The  score of two teams A and B in 10 matches are as: 


          |  
             A :  | 
           
             B:  | 
 
         
          |  
             40  | 
           
             21  | 
 
         
          |  
             32  | 
           
             14  | 
 
         
          |  
             0  | 
           
             29  | 
 
         
          |  
             40  | 
           
             13  | 
 
         
          |  
             30  | 
           
             5  | 
 
         
          |  
             7  | 
           
             12  | 
 
         
          |  
             13  | 
           
             10  | 
 
         
          |  
             25  | 
           
             13  | 
 
         
          |  
             14  | 
           
             30  | 
 
         
          |  
             5  | 
           
             0  | 


             Find the variance for both the series. Which team 
              is more consistent ? 
              
            
               Click here to enlarge 


            [next page] 
     | 
    
       Index 


        5.1 Introduction 
        5.2 Methods of computing dispersion 
        5.3 Range  
        5.4 Mean Deviation 
        5.5 Variance 
	5.6 Coefficient of Variation 
	5.7 Percentile 
        5.8 Quartiles and interquartile range  
        5.9 Skewness moments and Kurtosis 
        5.10 Kurtosis  
        
  
      Chapter 6 


	 |