|
5.2 Phases
A phase is defined as a physically distinct but homogenous part of a system separated from other parts by boundary surface.
Phase diagrams : The effect of changes in
temperature or in pressure or in the composition on the changes
of the phase in a system can be understood easily when it is presented
graphically. The conditions under which the different phases can
co-exist are conveniently described by graphs called phase diagrams.
Figure 17

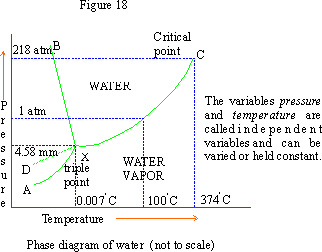
The line XB is the locus of points (P, T) at which a solid and a liquid can co-exist. Similarly co-existence of other phases namely liquid-gas and solid-gas can be represented by lines XC and XA respectively. The point of intersection of any two curves will indicate the co-existence of all the three phases solid-liquid-vapor in equilibrium. This point is called a triple point.
Phase diagrams are classified based on the number of components as
- one component system
- two component system
One component system :
The Water System : The simplest and typical example of a
one component system is that of water. Three possible phases depending
on pressure and temperature are ice, water and water vapor.

The line XC is the vapor pressure curve for water which increases by increasing temperature.
Each of the three lines XA, XB and XC indicates the two phase equilibria and represents univariant states. The areas enclosed between these lines represent regions of a single phase, i.e. bivariant states. Thus the region AXB is ice, BXC is water and CXA is vapor.
X is the triple point where all the three phases (ice, water and vapor) co-exist. The pressure at this point is found to be 4.58 mm. The freezing point is 00C at 760 mm and changes by 10 when pressure changes by 140 atm. Hence at 4.58 mm the freezing point is 0.0070C.
|