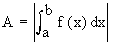
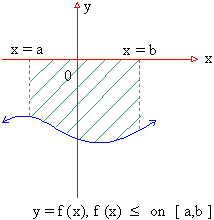
(2) If f(x) £ on [ a,b ] then the area  i.e. the area lying above the graph of y = f (x), below the x-axis and between the ordinates x = a and x = b is i.e. the area lying above the graph of y = f (x), below the x-axis and between the ordinates x = a and x = b is
i.e. 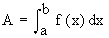
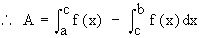
(3) If F (X)³ 0 ON [ a, c ] and f (x) £ 0 on [ c, b ], then the area  of the region bounded by y = f (x), the x-axis and the ordinates x = a and x = b, is determined by of the region bounded by y = f (x), the x-axis and the ordinates x = a and x = b, is determined by 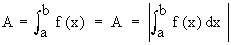
So it is clear that one has to determine all points at which the graph of y = f (x) crosses the x-axis and the sign of f on each interval.
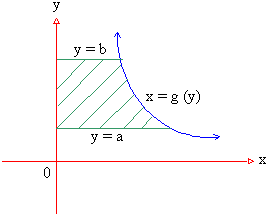
Remark : Inter changing x and y, it follows that the area bounded by a continuous curve x = g (y), the y-axis and the lines y = a and y = b is given by 
[next page]
|
Index
8.1 Introduction
8.2 Area
8.3 Volumes
8.4 Mean Value
8.5 Arc Length(Rectification)
Chapter 1
|
