7.9 Normal Distribution
The normal distribution developed by Gauss is a continuous distribution of maximum utility.
Definition : If we know a curve such that
the area under the curve from x = a to x = b is equal to the probability
that x will take a value between a and b and that the total area
under the curve is unity, then the curve is called the probability
curve.
If the curve is described by a relation y = f (x) then y = f (x) is called a probability density or simply probability function.
Among all the probability curves, the normal curve is the most important one. The corresponding function is called the normal probability function and the probability distribution is called the normal distribution. The normal distribution can be considered as the limiting form of the Binomial Distribution, however n, the number of trials, is very large and neither P nor q is very small.
The normal distribution is given by

where y = ordinate, x = abscissa of a point on the curve, u = the mean of x, s = S. D.of x.
x = a constant = 3.1416 and e = a constant = 2.7183.
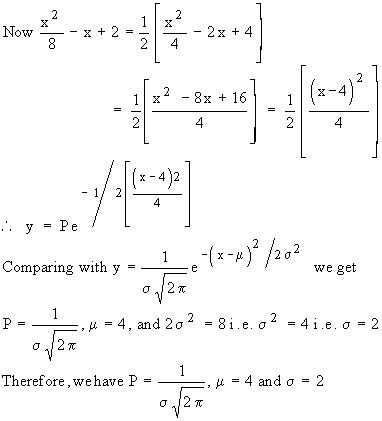
Example Find P, mean and the standard
deviation of the normal distribution given by

Solution : 
The Normal Curve : The shape of a normal curve is like a bell. It is symmetrical about the maximum ordinate If P and Q are two points on the x-axis (see figure), the shaded are PQRS, bounded by the portion of the curve RS, the ordinates at P and Q and the x-axis is equal to the probability that the variate x lies between x = a and x = b at P and Q respectively. We have already seen that the total area under a normal curve is unity. Any probability distribution, defined this way is known as the normal distribution. The distribution can be completely known if we know the values of m and s. Therefore m and s are known as the parameters of the distribution. The normal distribution with mean m and standard deviation s is denoted by N (m, s ).
[next page]
|