Support the Monkey! Tell All your Friends and Teachers

Help / FAQ


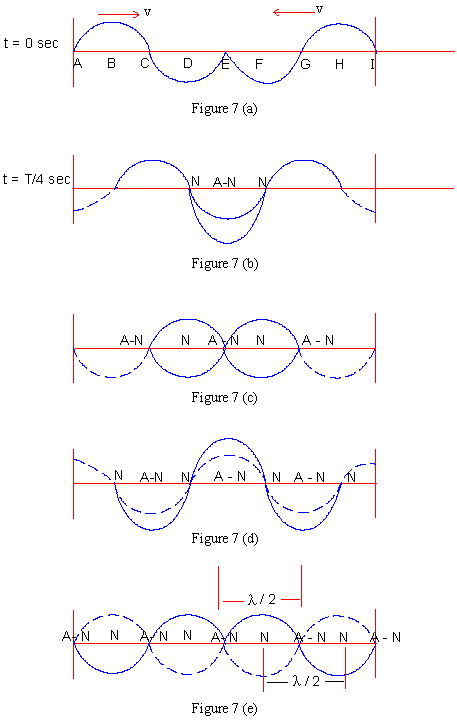
The formation of standing waves and nodes, anti-nodes is illustrated in the following diagram.

Click here to enlarge

The diagrams (a) to (e) represent the waves at successive instants as they propagate in their respective directions. The dotted curves represent the generations of further pulses, as the particles at A & I are allowed to vibrate further over a of time period T.

As the waves start superposing over each other at sec, the particles at E, C and G, A and I vibrate with maximum aplitude and hence anti-nodes (A-N) occur at these positions; whereas particles at D and F, B and G do not vibrate at all. These positions are called Nodes.

It should be noted that the particles where A-N are formed virate with maximum amplitude therefore for waves of frequency ³ 10 Hz i.e. sec; these particles move from the maximum to -ve maximum along Y-axis (say) in an interval of ³ , hence the persistence of vision gives rise to appearance of stationary loops when the standing waves are formed on strings.

Index

10.1 Intensity and Pitch
10.2 Doppler Effect
10.3 Superposition Principle
10.4 The Phenomenon of Beats of Sound
10.5 Standing or Stationary Waves
10.6 Forced Oscillations and Resonance

Chapter 11


All Contents Copyright © All rights reserved.
Further Distribution Is Strictly Prohibited.


Search:
Keywords:
In Association with Amazon.com